Microsegmentation (Tenant Instance) Web Interface Walkthrough
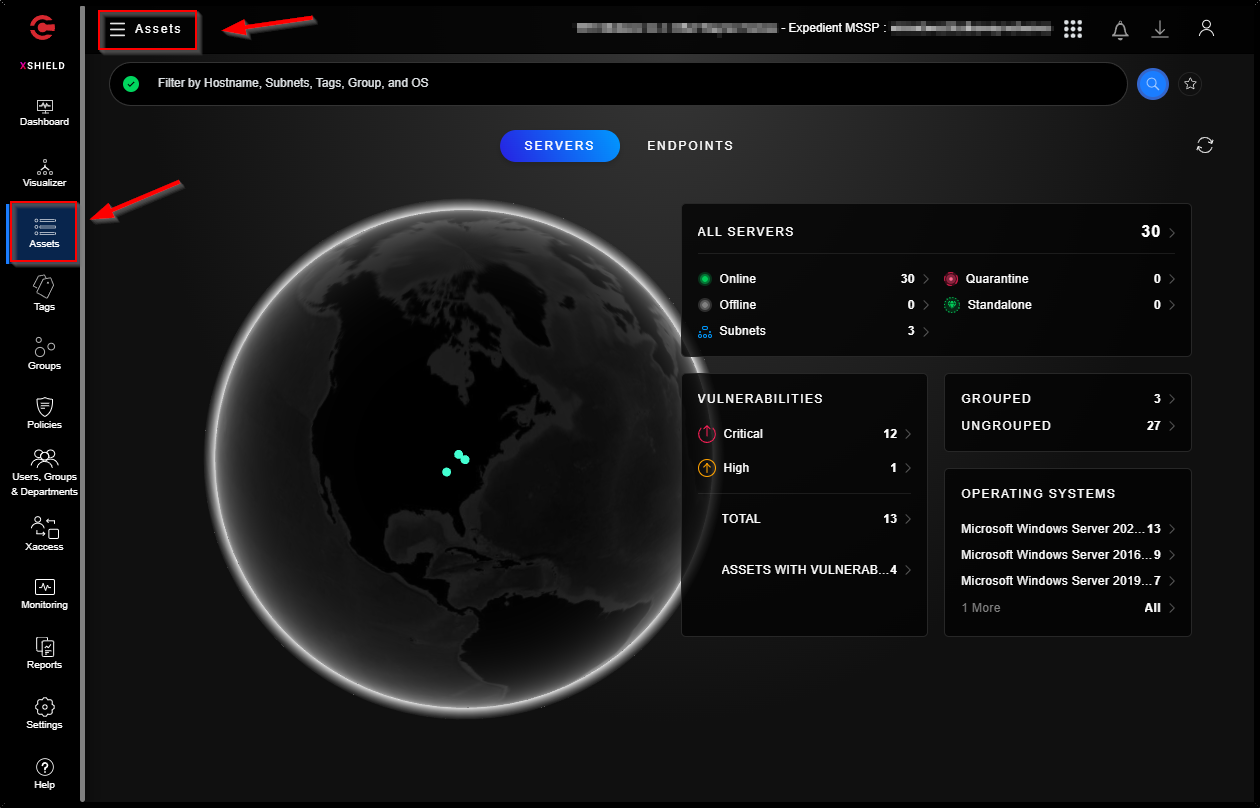
The “Assets” dashboard provides a quick overview of all assets related information such as subnets for a tenant, vulnerability and list of OSes that are part of the tenant. You can view number of subnets and assets associated to a host by clicking on a location on the globe.
You can search and view assets with Flexible Query Language (FQL) that allows you to quickly and precisely locate and process information on the Asset page.
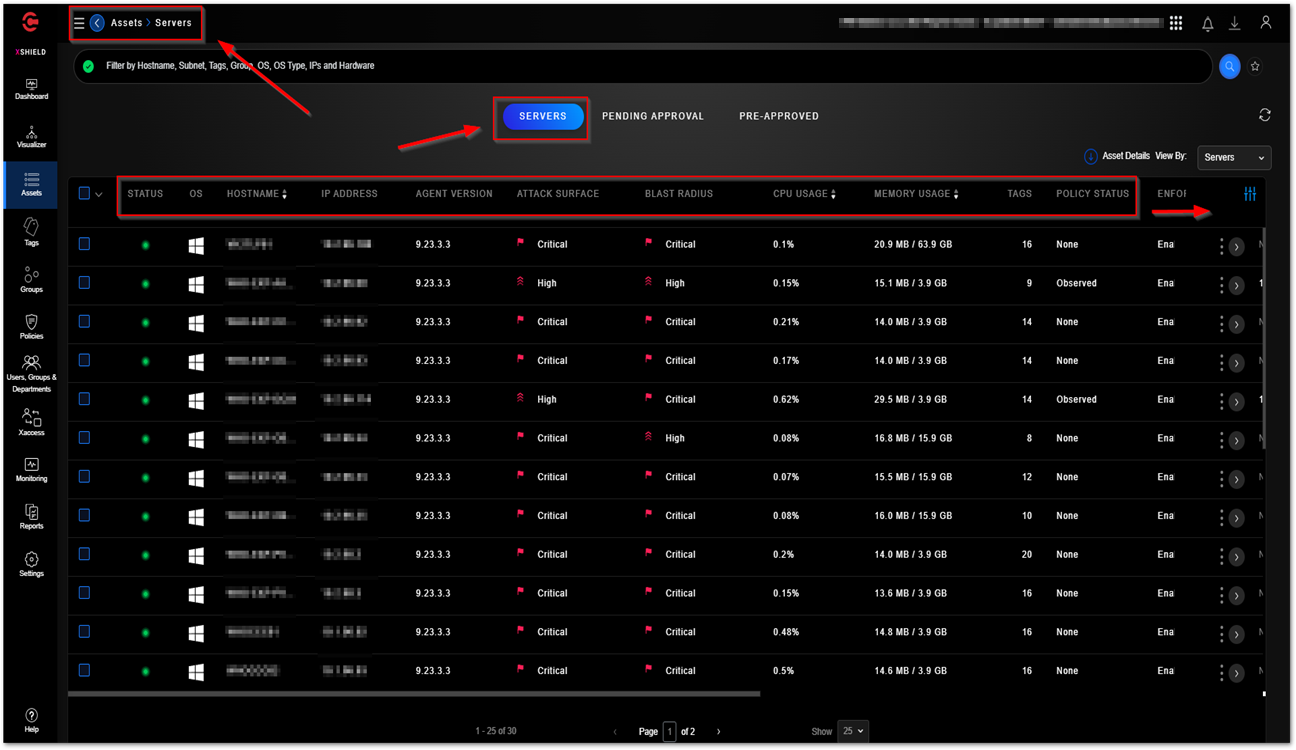
The “Assets - Servers” section lists all the servers that have microseg agents installed. This table displays the status, hostname, IP address, agent version, attack surface, blast radius, CPU and memory usage of the agent, number of tags, number of assigned groups, group names, number of firewall rules, number of vulnerabilities, and any recommended policies. This table can be downloaded to a CSV file if needed.
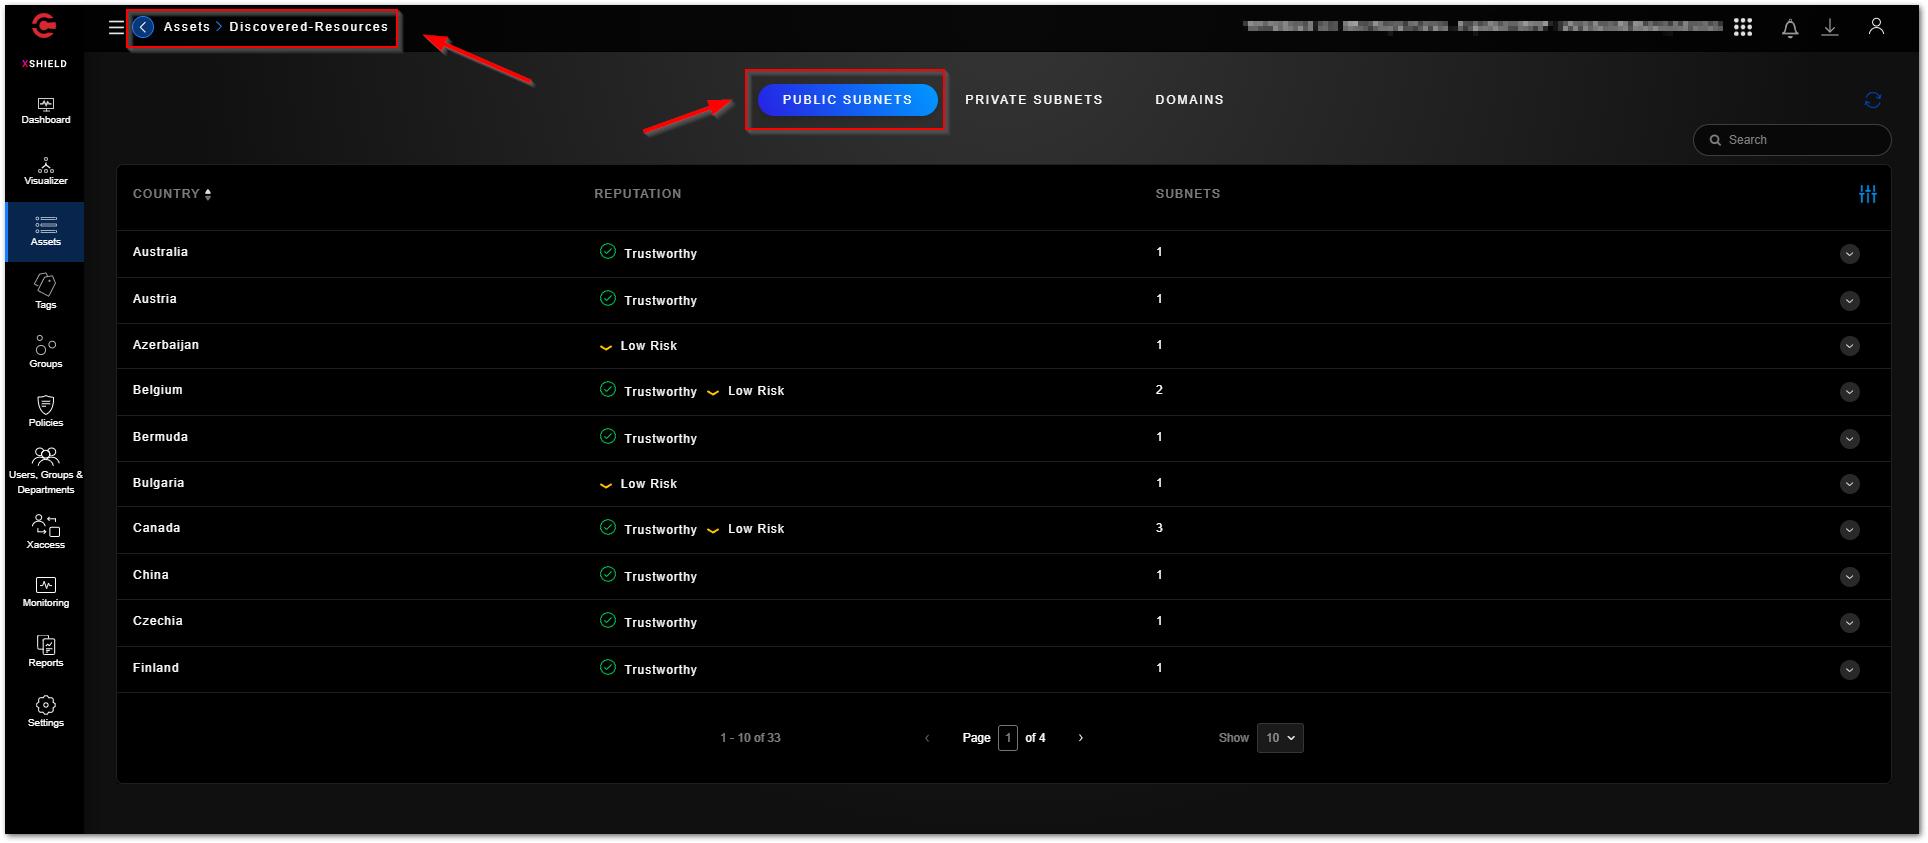
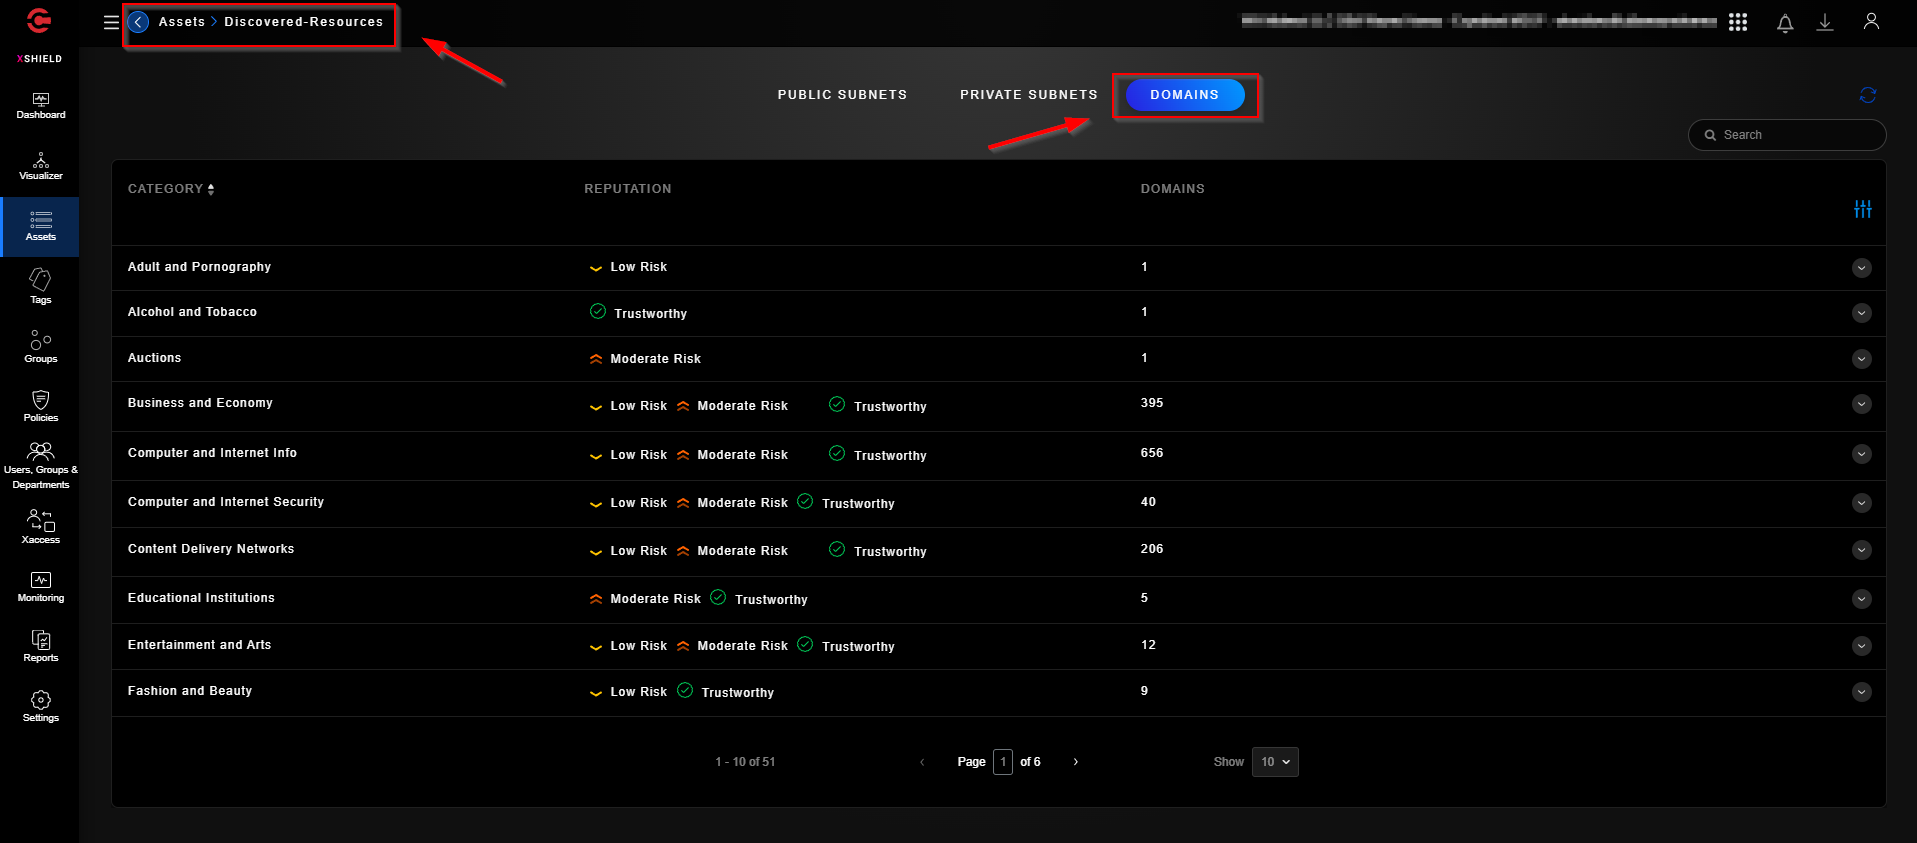
The “Assets - Discovered” tab lists any public subnets, private subnets, and domains that the microsegmentation agents have discovered while running on the assets they have been deployed on. This gives you a holistic view into what your assets have been communicating with over time.
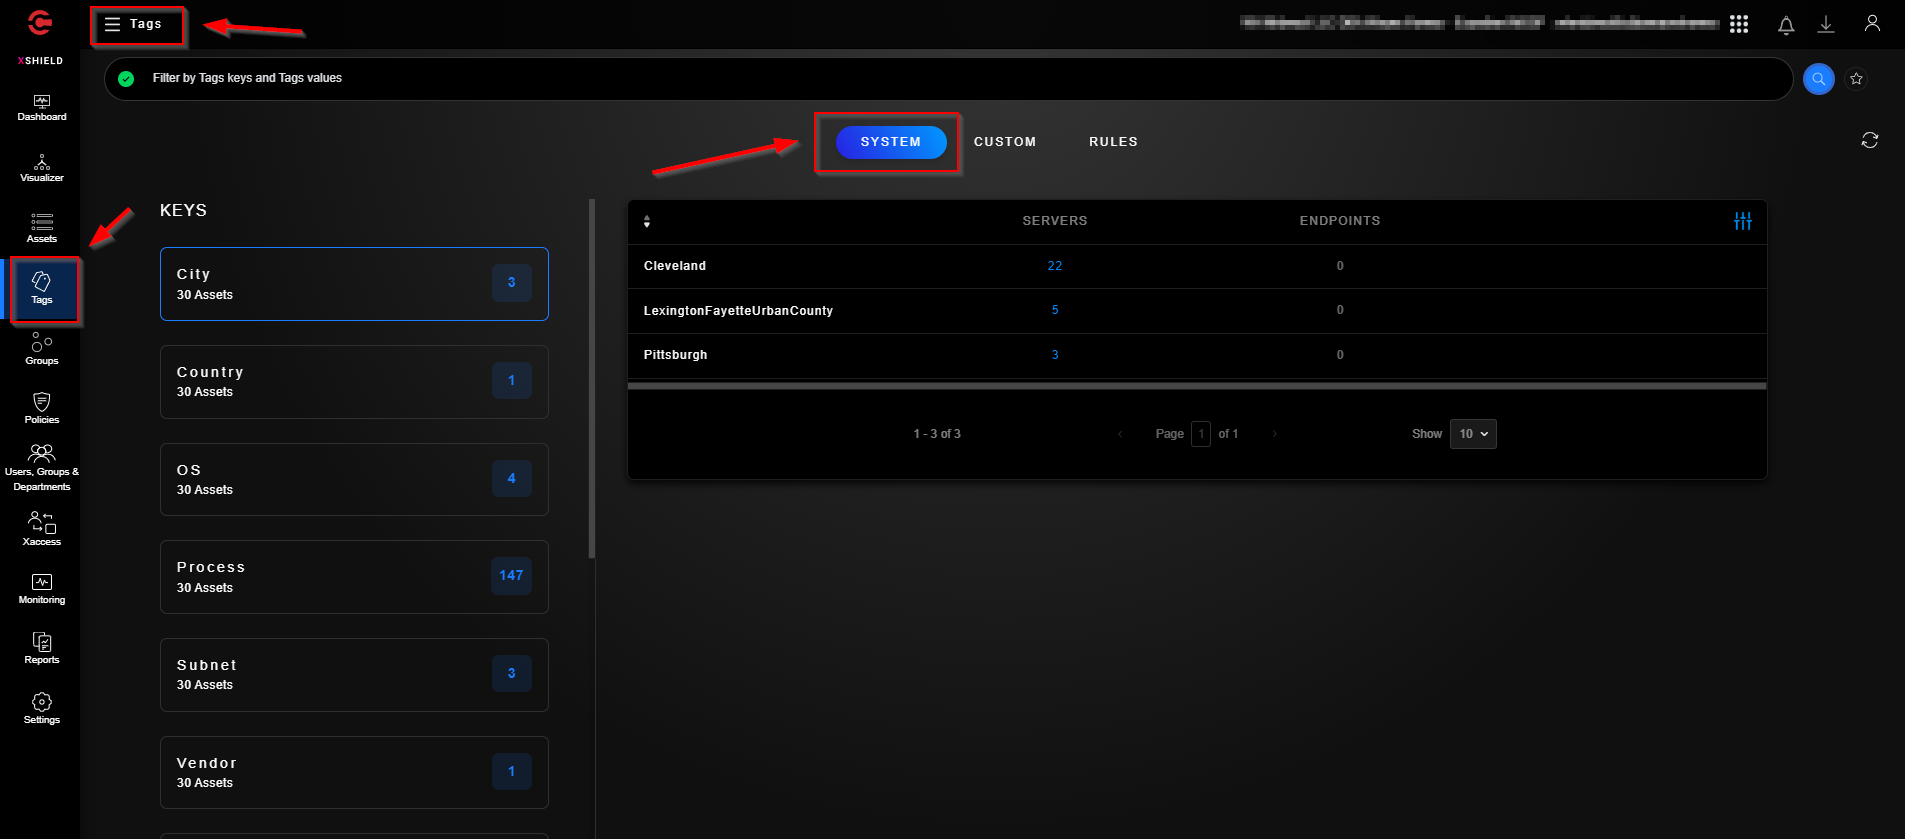
The “Tags” section offers flexible tag management to classify and mark ownership of assets. A tag is a label made up of “Tag Name (Keyword)= Tag Value (Description)” pair. You can assign a tag as a label to any asset or application workload. Tags are restricted to a tenant. Out-of-box tags are pre-created. You can also create custom tags.
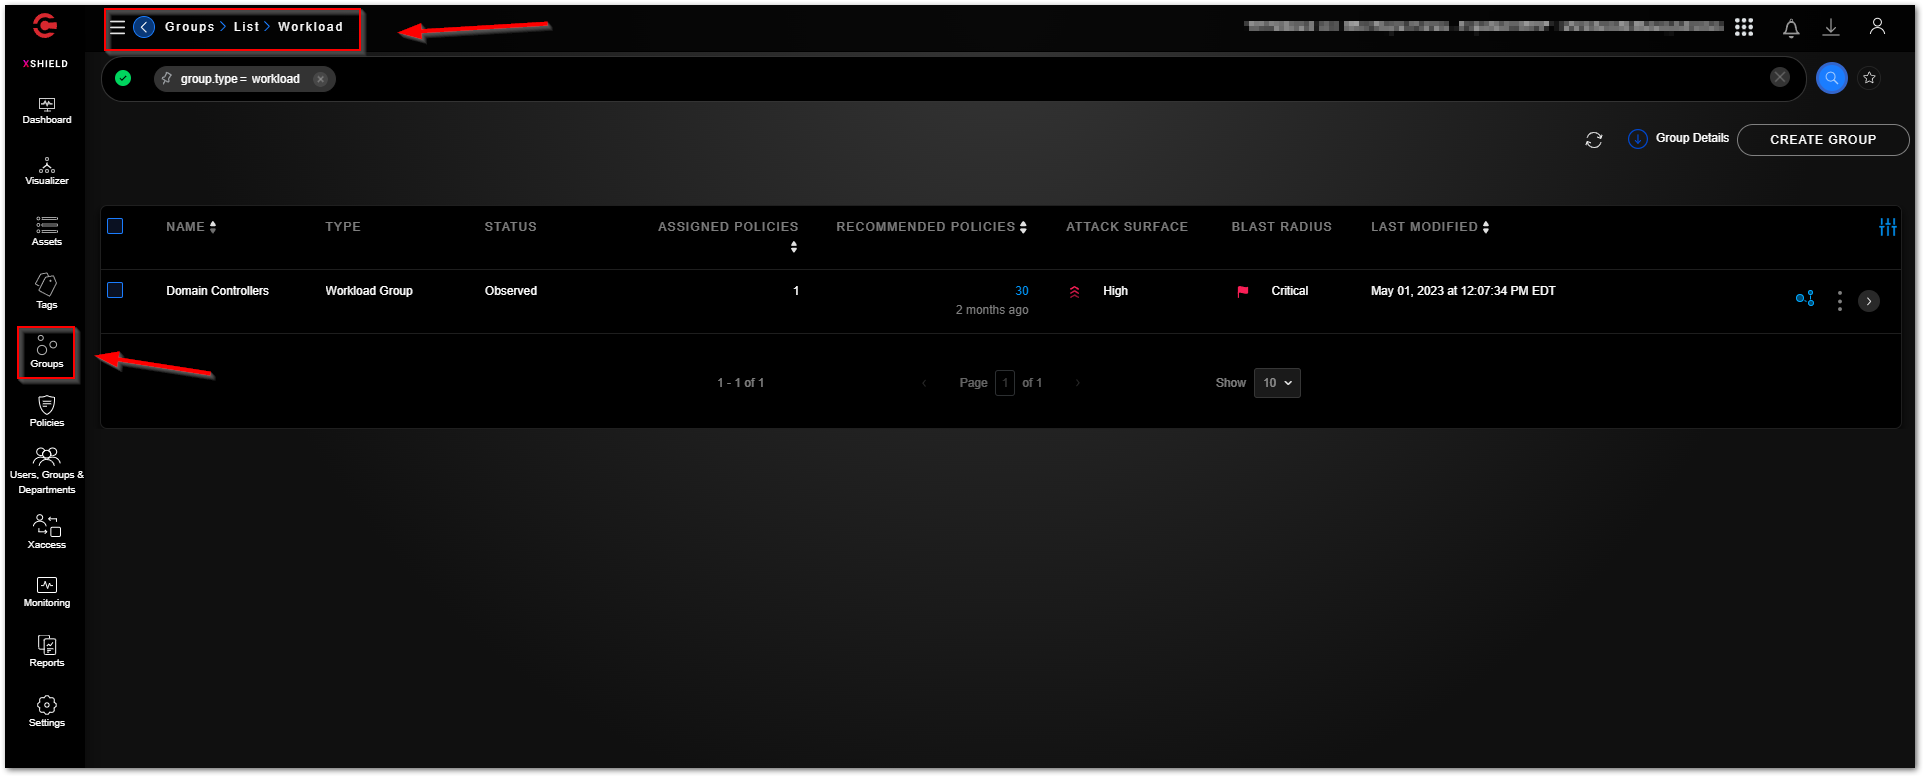
The “Groups - Workload” section displays a logical collection of assets. Workload assets can be grouped by multiple criteria such as asset attributes, tags (Role, Application, Location, and/or Environment), and network segments where the workloads (applications) are deployed. Grouping workload assets also lets you use the Visualizer and Policy Builder features to build policies for the Workload groups.
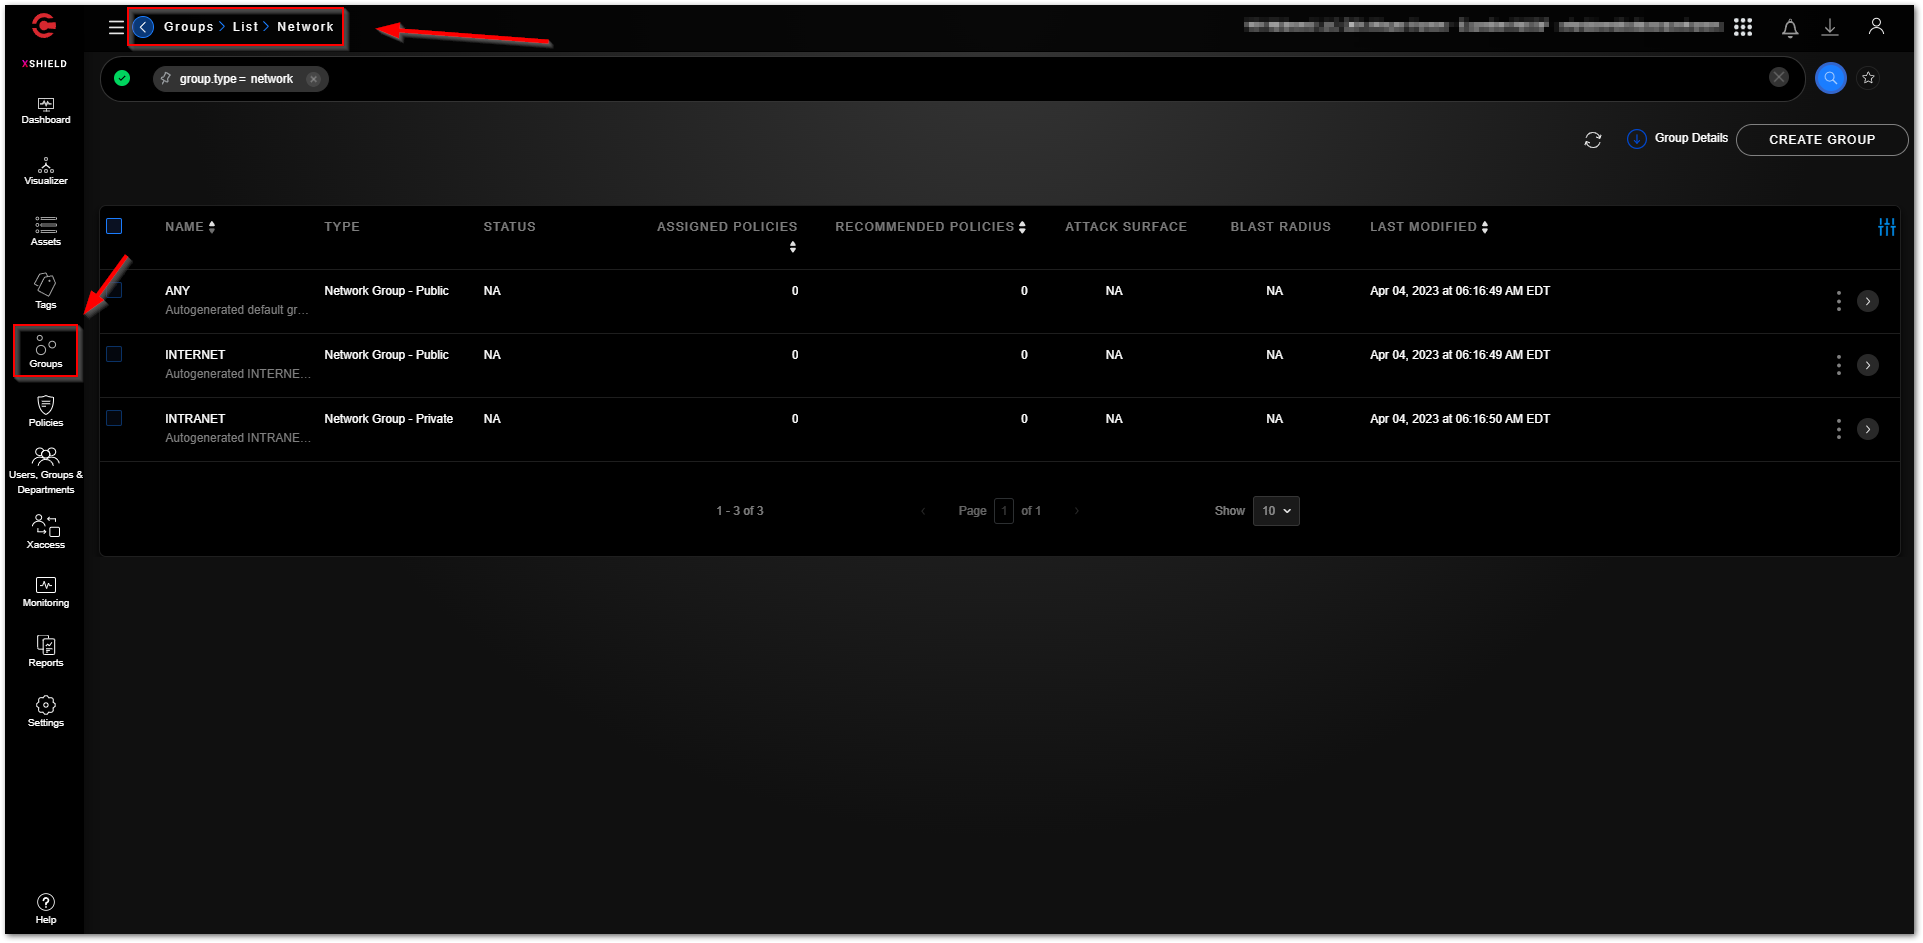
The “Groups - Network” section contains network groups. A Network group is a logical group of private or public subnets and/or IP addresses. Grouping subnets by the purposes they serve can help you enforce common Access policies at scale to subnets and to grant secure access to the Workload groups which access the enforced subnets. For example, a Network group to provide infrastructure services such as DNS and DHCP to Workload groups.
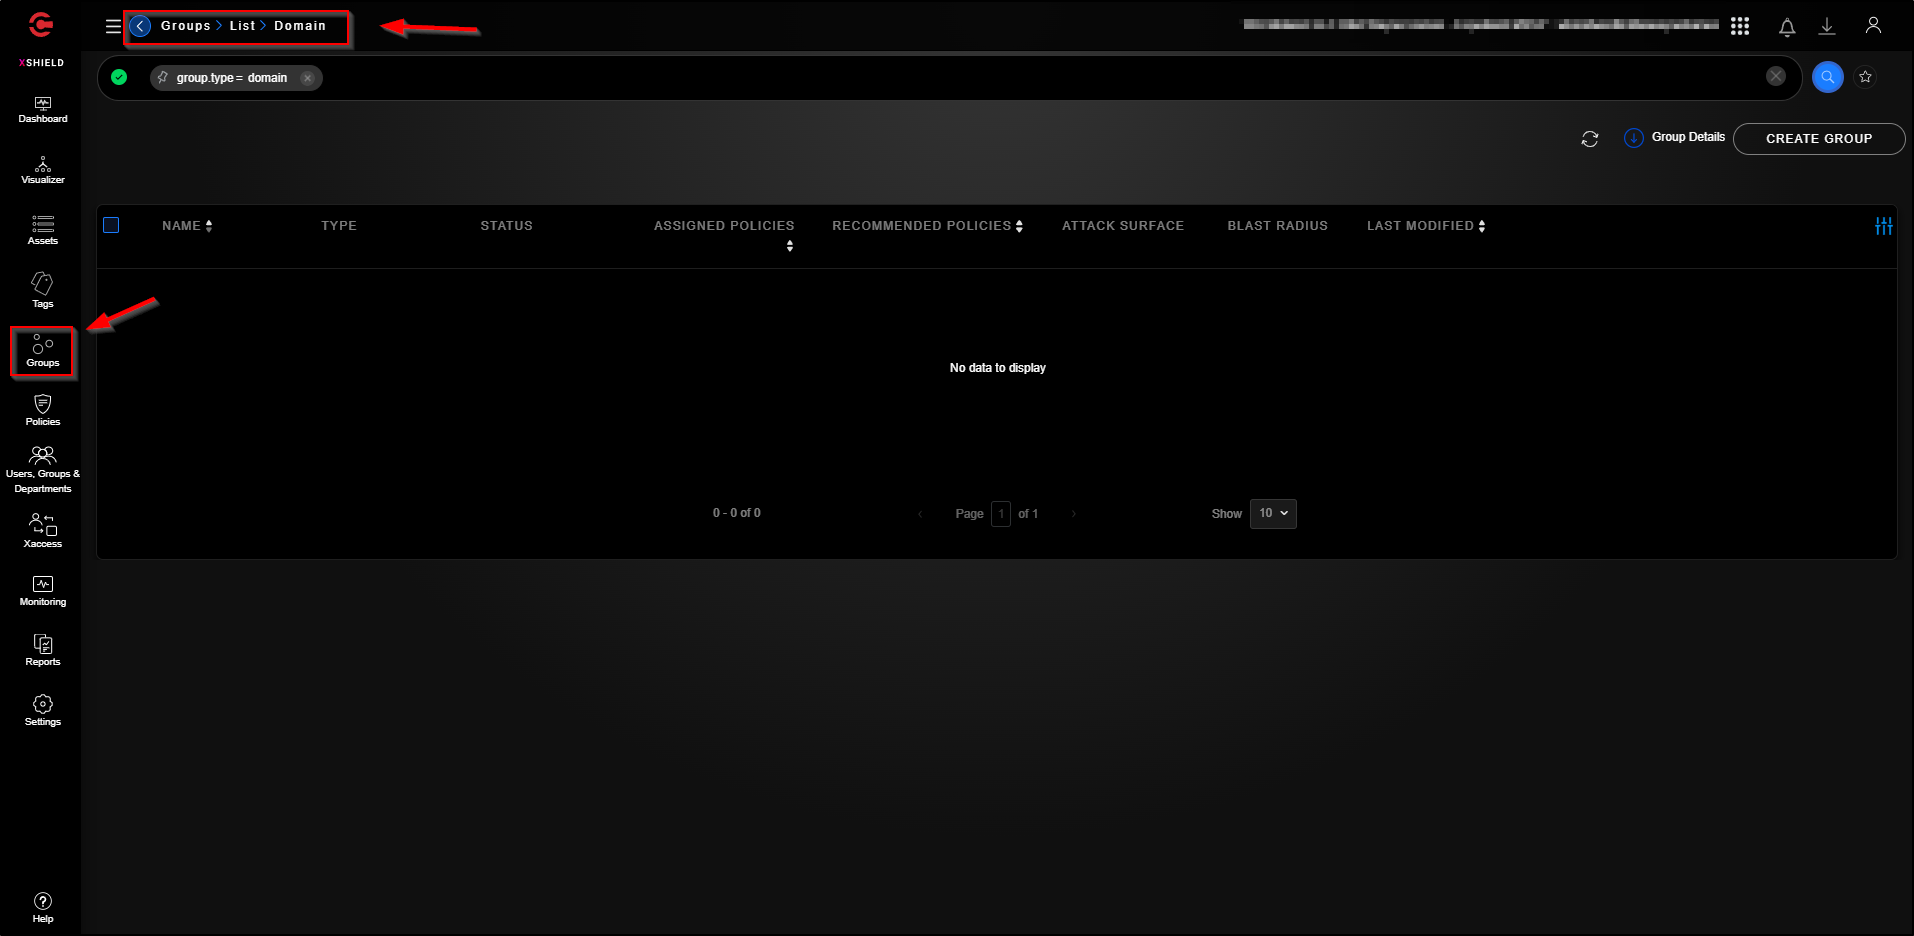
The “Groups - Domain” section contains Domain groups. Use Domain groups in to logically group domains by the purpose they serve and then allow Workload groups to download and install updates from the selected Domains groups. For example, create a group of Microsoft update domains Microsoft updates and create Access policies with Workload groups that use Microsoft subscriptions. Similarly, create another Domain group Linux updates to update Linux workloads. Grouping update servers by their Fully qualified domain names (FQDNs) can make update management easy.
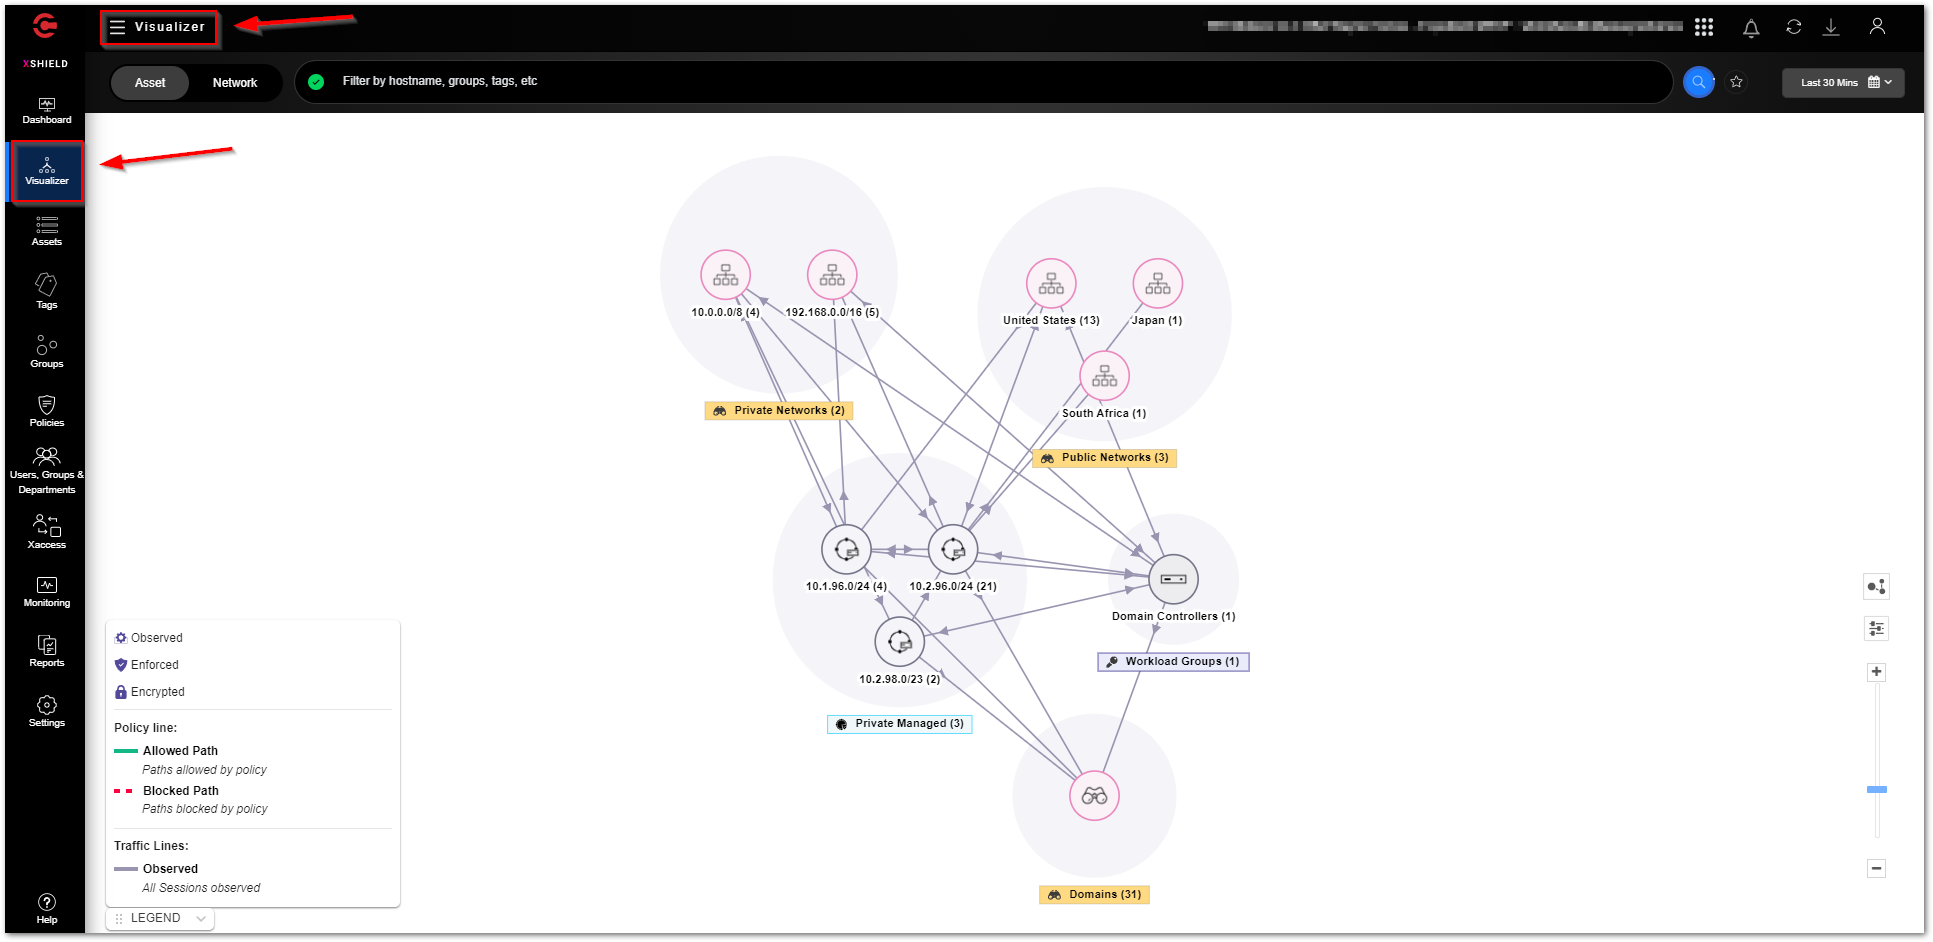
The “Visualizer” is a traffic and threat reputation analysis tool. Visualizer is built for a bird’s eye view of the network traffic between the managed (assets) and discovered resources. It’s a useful tool for production networks and networks in the Policy simulation mode to quickly check enforcement status, analyze traffic and its Threat reputation and make quick changes to the groups. The initial data shown in Visualizer is capped to the last 30 minutes.
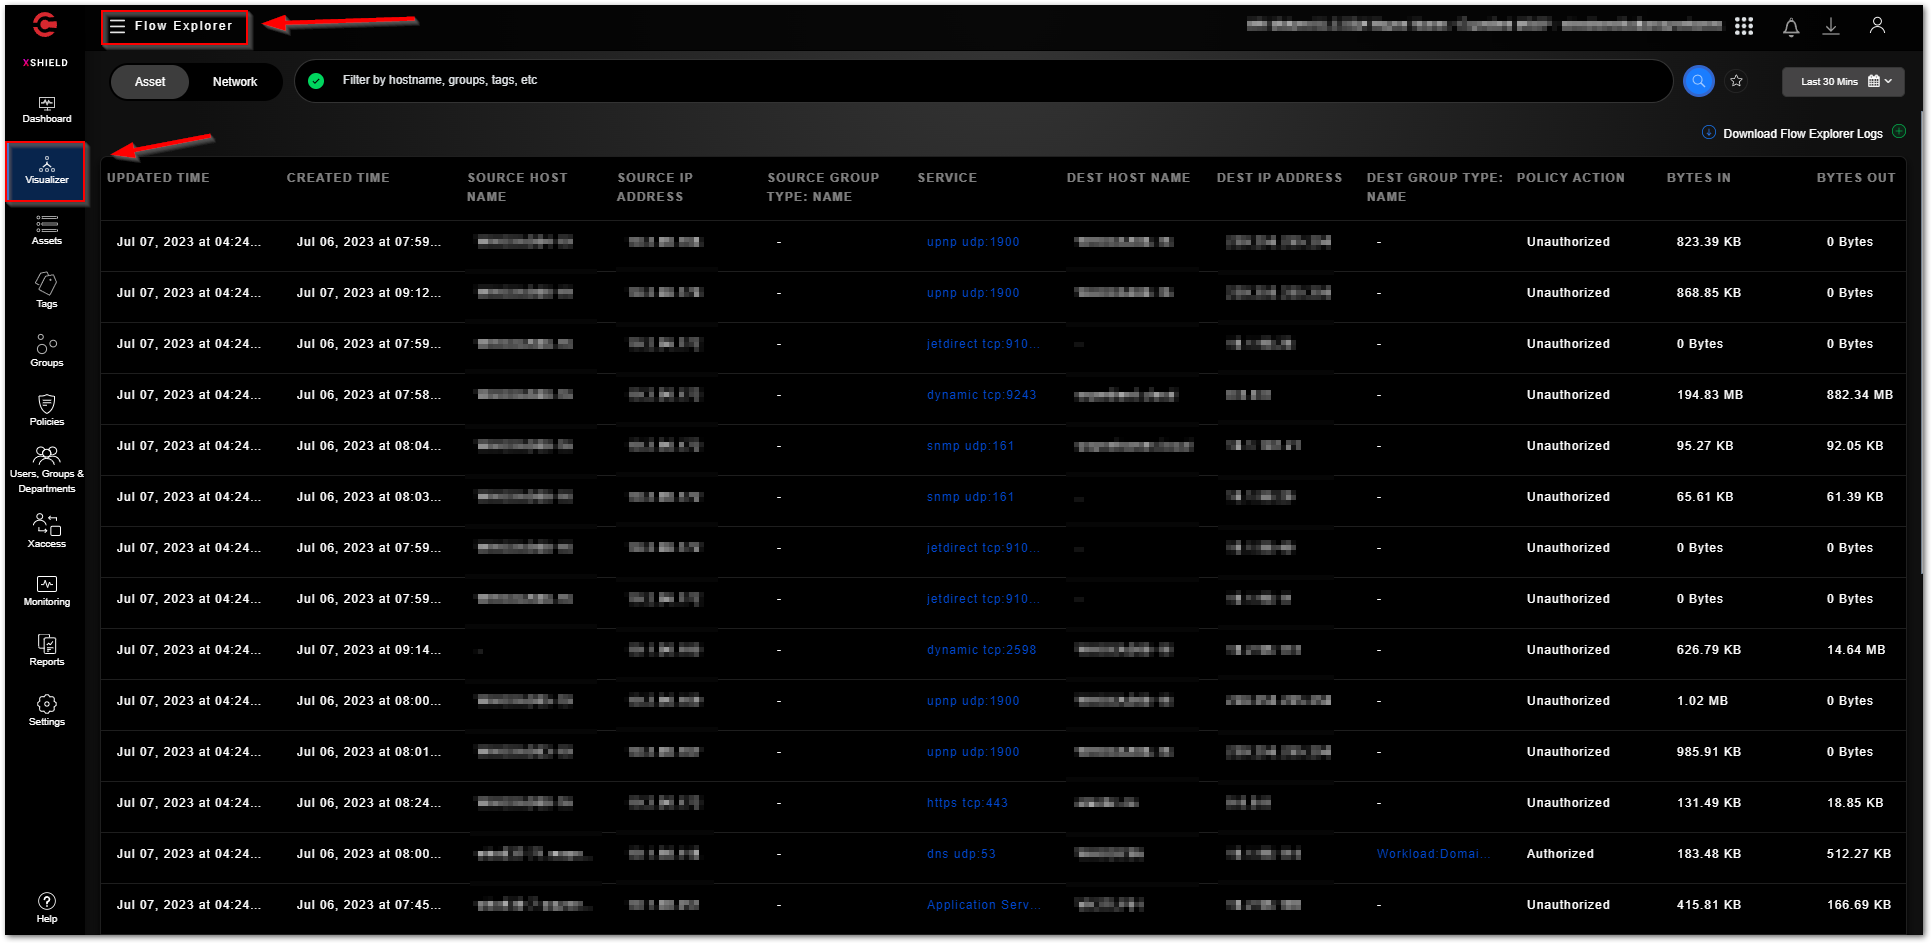
The “Flow Explorer” allows you to view the details of traffic flow to analyze the traffic logs for data transferred between Managed Assets, Discovered Assets, Workload Groups, Domain Groups, and Endpoint Groups, the IP addresses and hostnames they use, tags and departments they are associated with, and User IDs. The last 30 minutes of traffic flows are displayed by default. Filters can be used to filter on interesting traffic flows. Traffic flow data can also be downloaded to a CSV file.
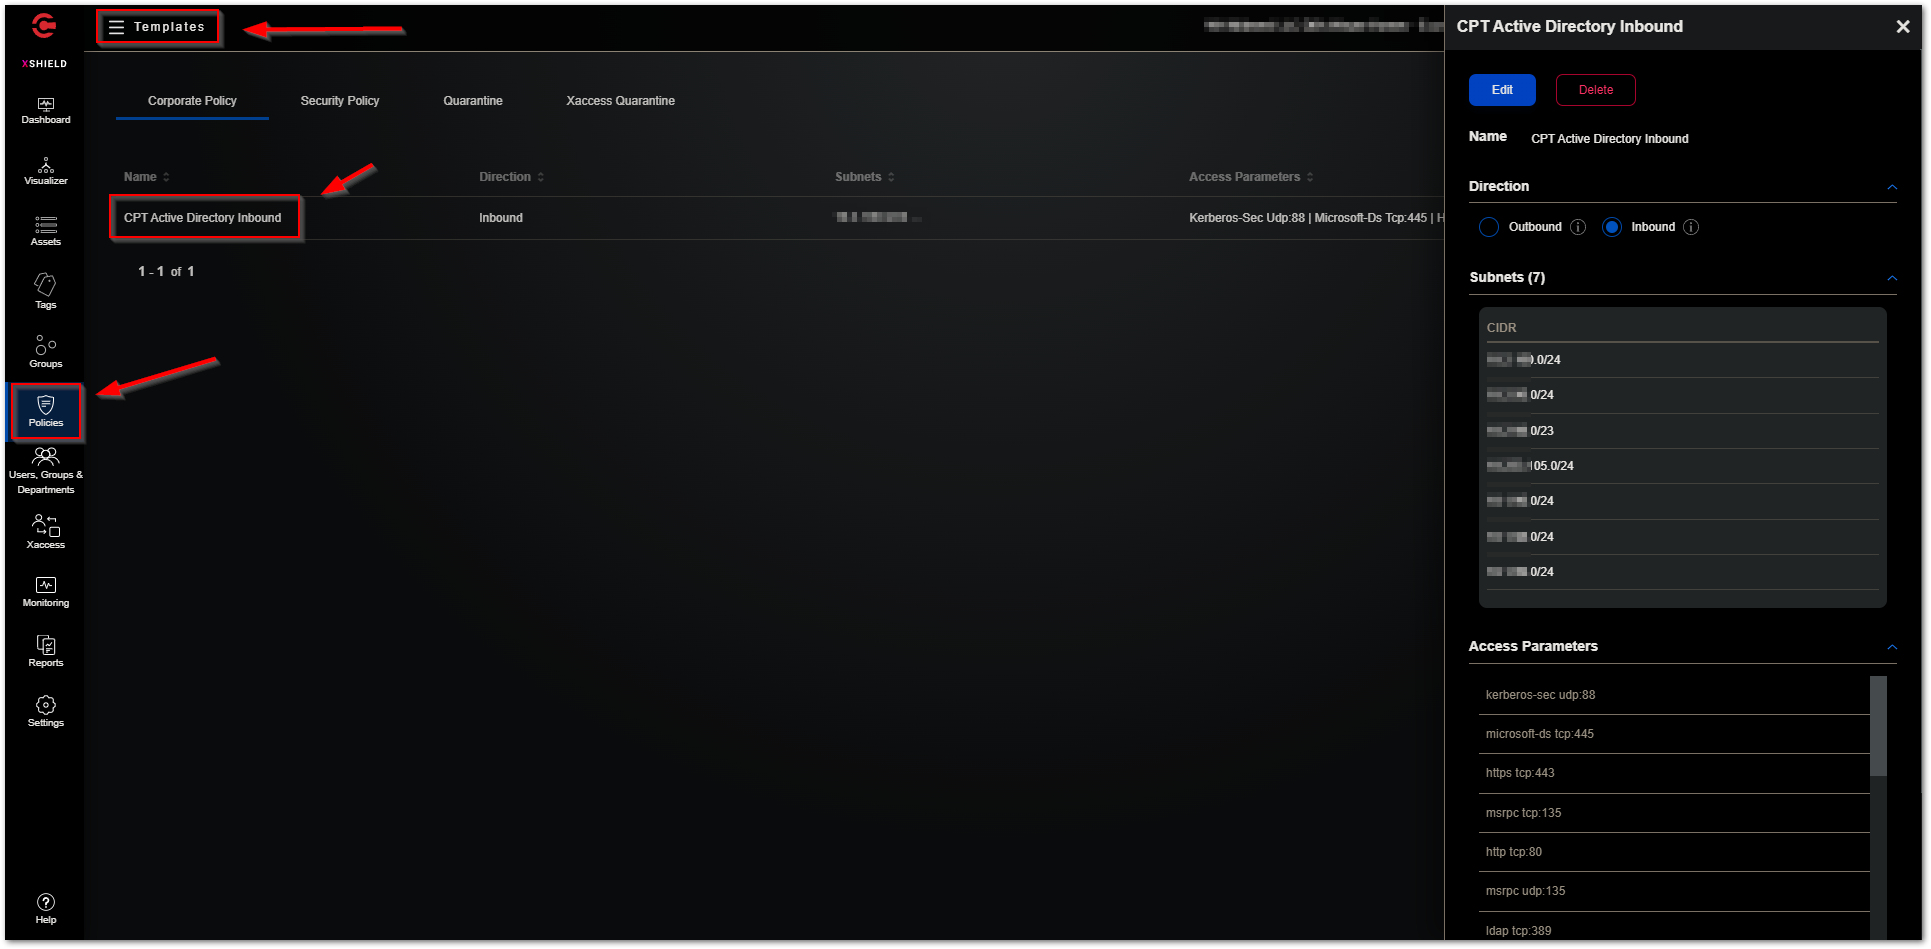
The “Policies - Templates” section allows you to create several types of policy templates to use with workload groups. In the screenshot below a Corporate Policy template called “CPT Active Directory Inbound” has been created. Corporate policy templates help you to create reusable Access policies to access the infrastructure services in your network. The term 'Corporate' refers to the basic TCP and UDP services such as Domain Name System (DNS) and Active Directory (AD) that must be accessible to application workloads. A Corporate policy template, also known as CPT, is a set of 'allowed' ports and protocols in one or more IP subnets. Use CPTs to manage workloads' access to infrastructure services centrally.
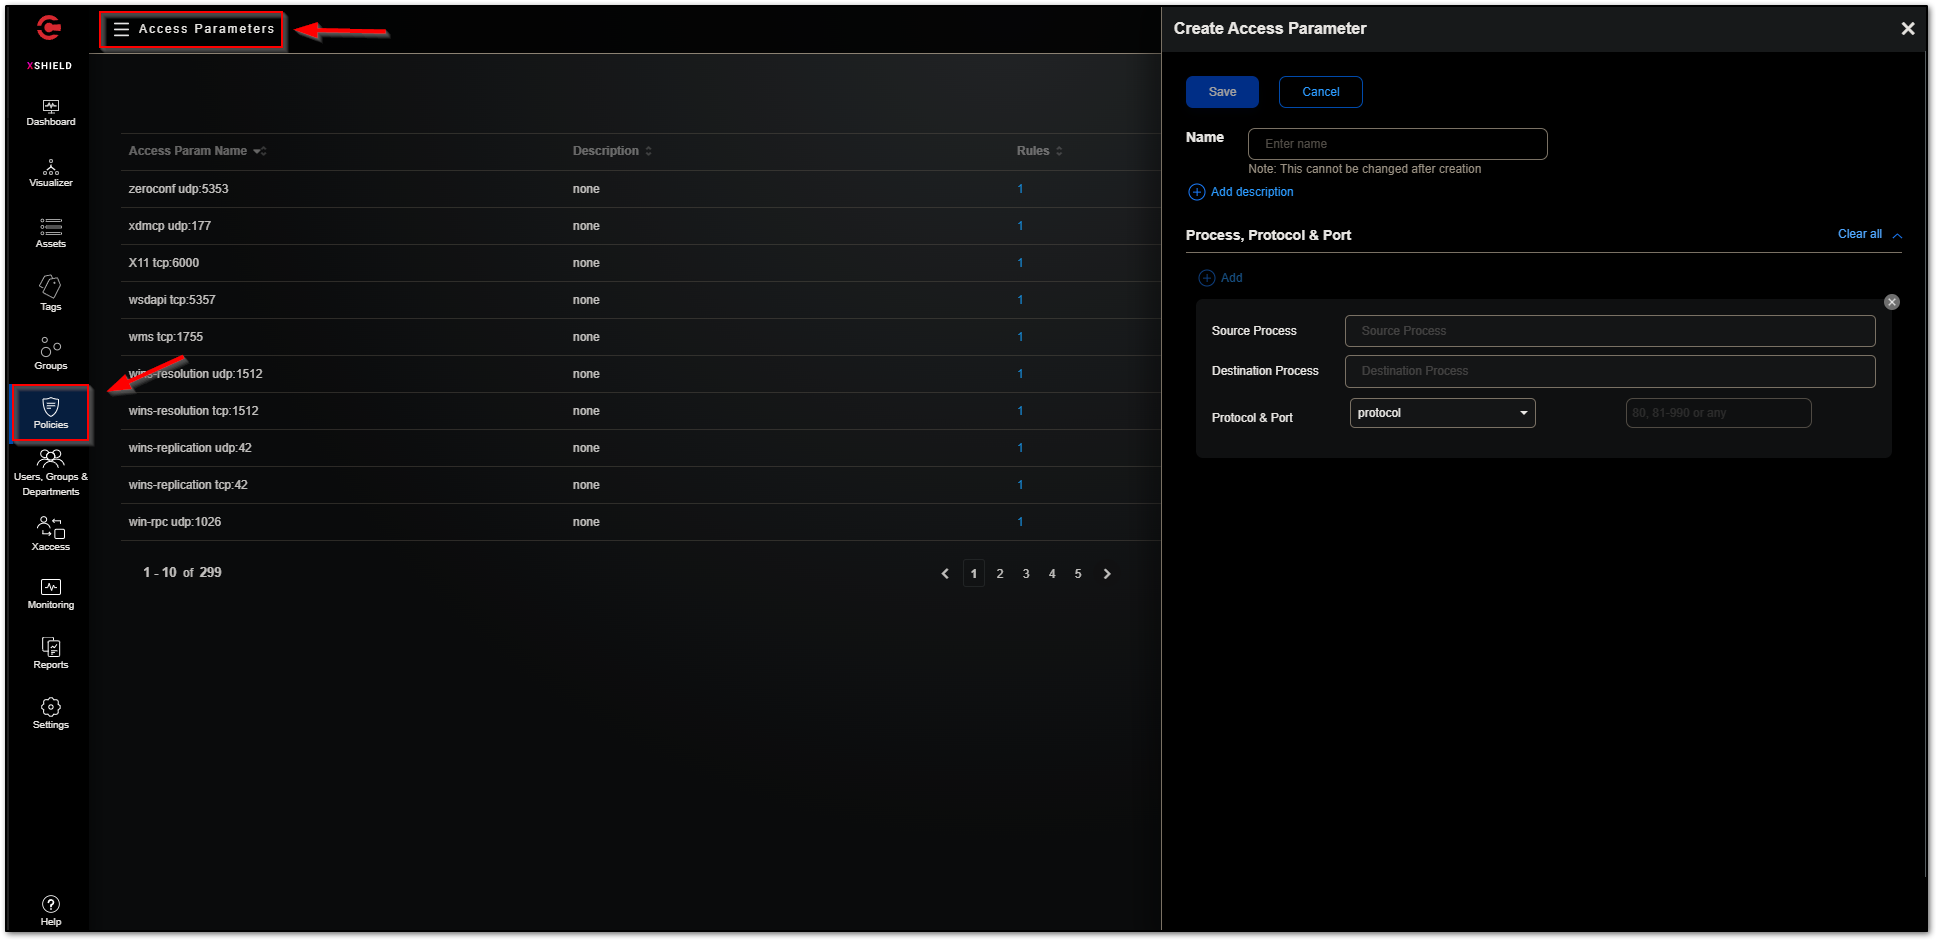
The “Policies - Access Parameters” section allows you to create custom access parameters. An access parameter is a named combination of port/port range and the protocol used on them. Access parameters are the building blocks of Access policies, Corporate policy templates, and Security policy templates that you use to control how Workload groups and other groups communicate.
When Access parameters are enforced on groups (through Access policies), the assets in the groups communicate only on the ports and protocols in the Access parameters. All other ports and protocols are blocked on the assets involved in the Access policies.
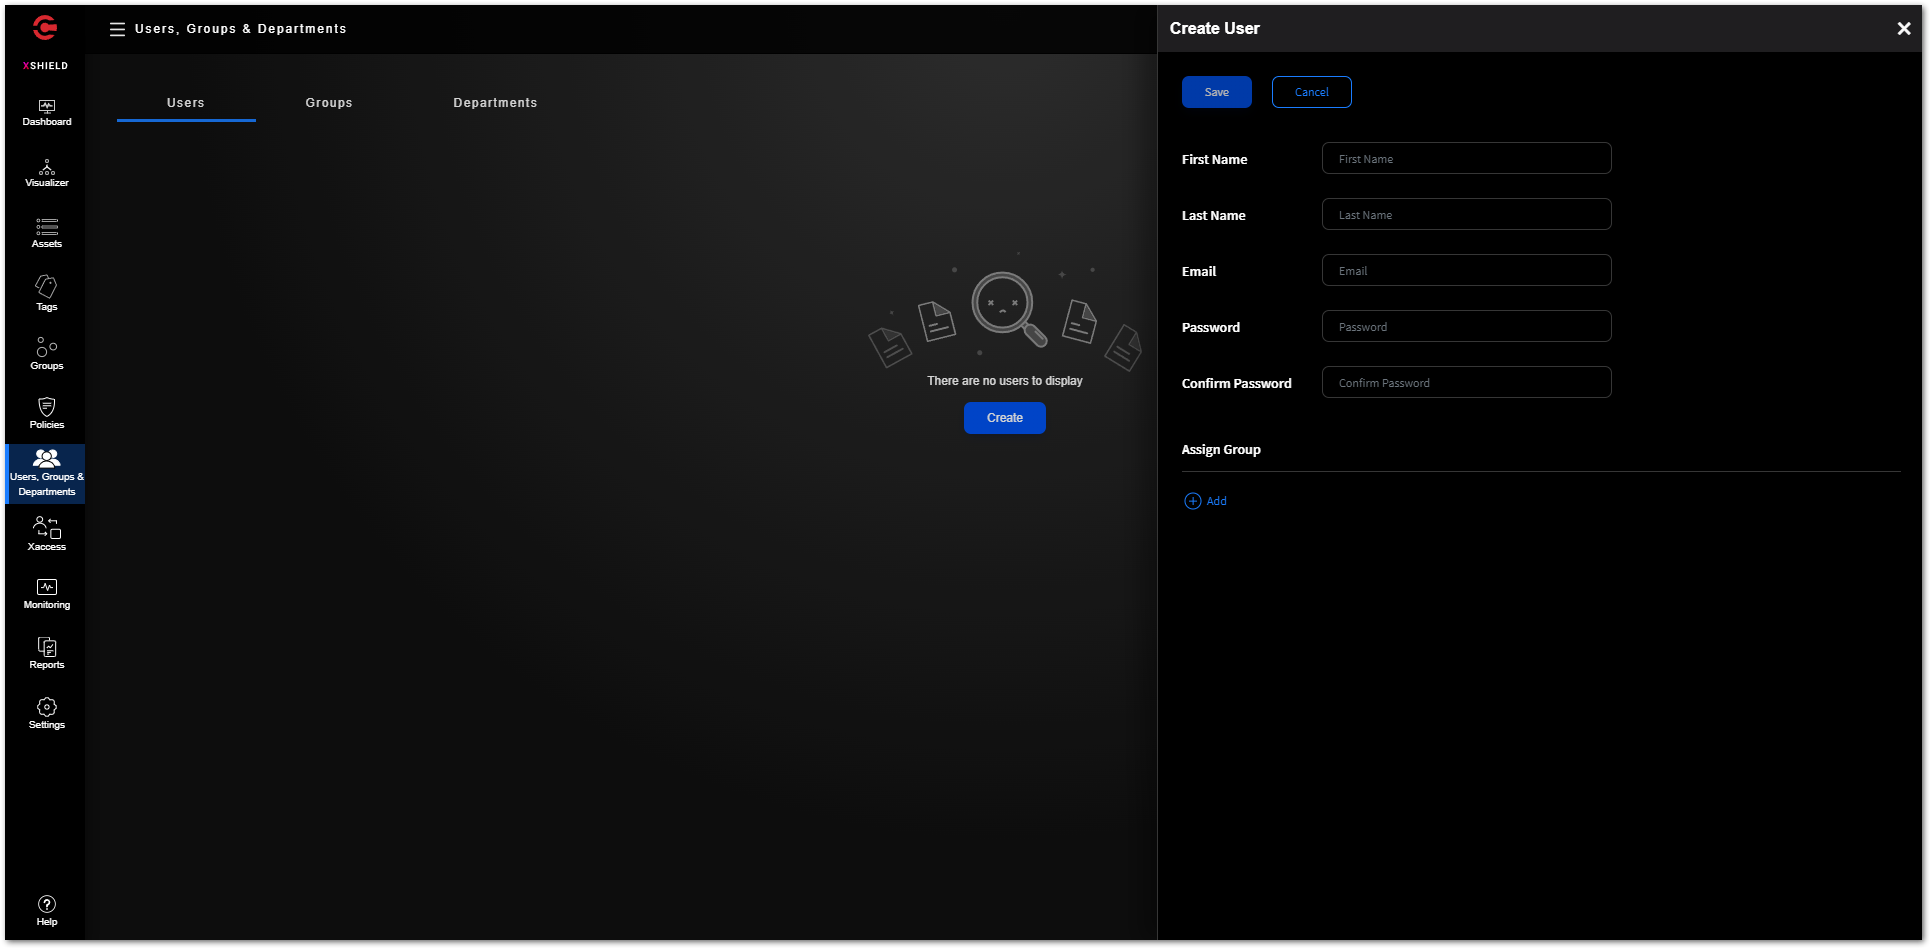
The “Users, Groups, & Departments” section is used in conjunction with User Access agents which are deployed on desktop-based OS’ such As Windows 10 and Windows 11. End users are granted access to the applications using policies. You must integrate your Identity Provider (IdP) solutions or Active Directory (AD) and fetch the details of the end-user identities.
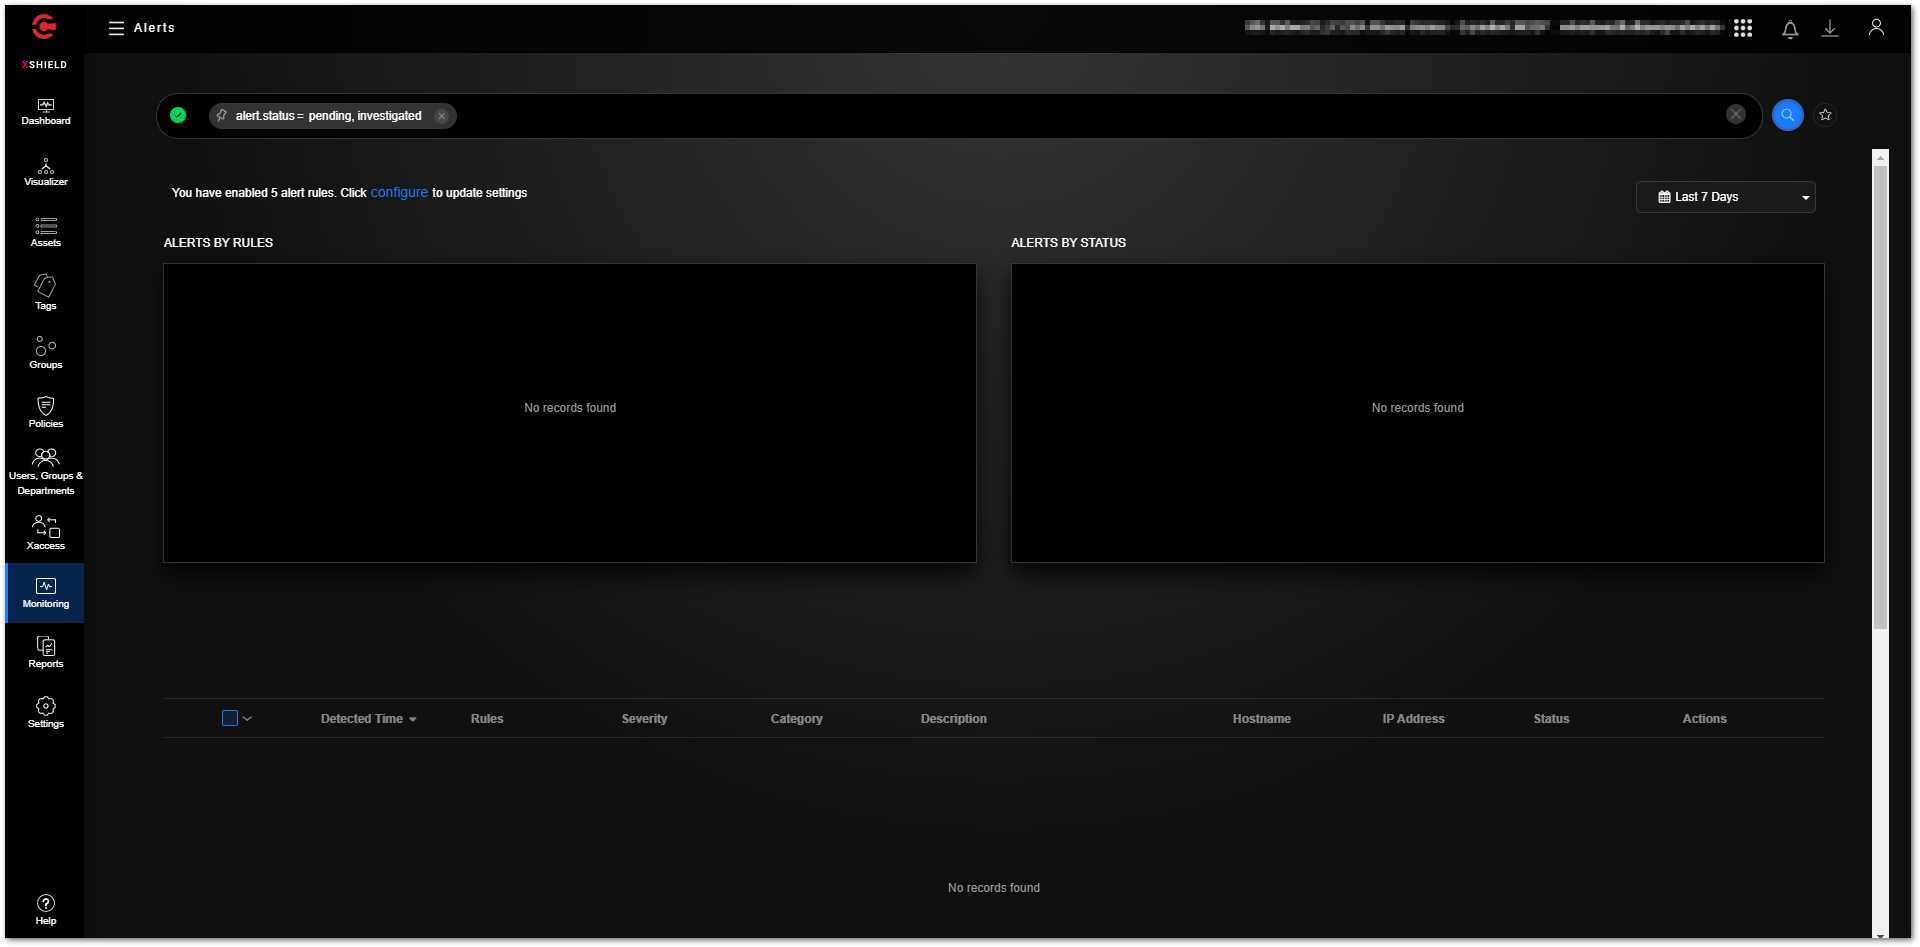
The “Monitoring - Alerts” section contains alerts for events such as unsafe perimeter traffic and anomalies and when the assets' reachability states change. Agents installed on the assets store the events as logs and send them to your instance in real-time. All the event logs sent to your instance from the assets include the details necessary to inspect and remediate the events. The details in the logs differ by type of event.
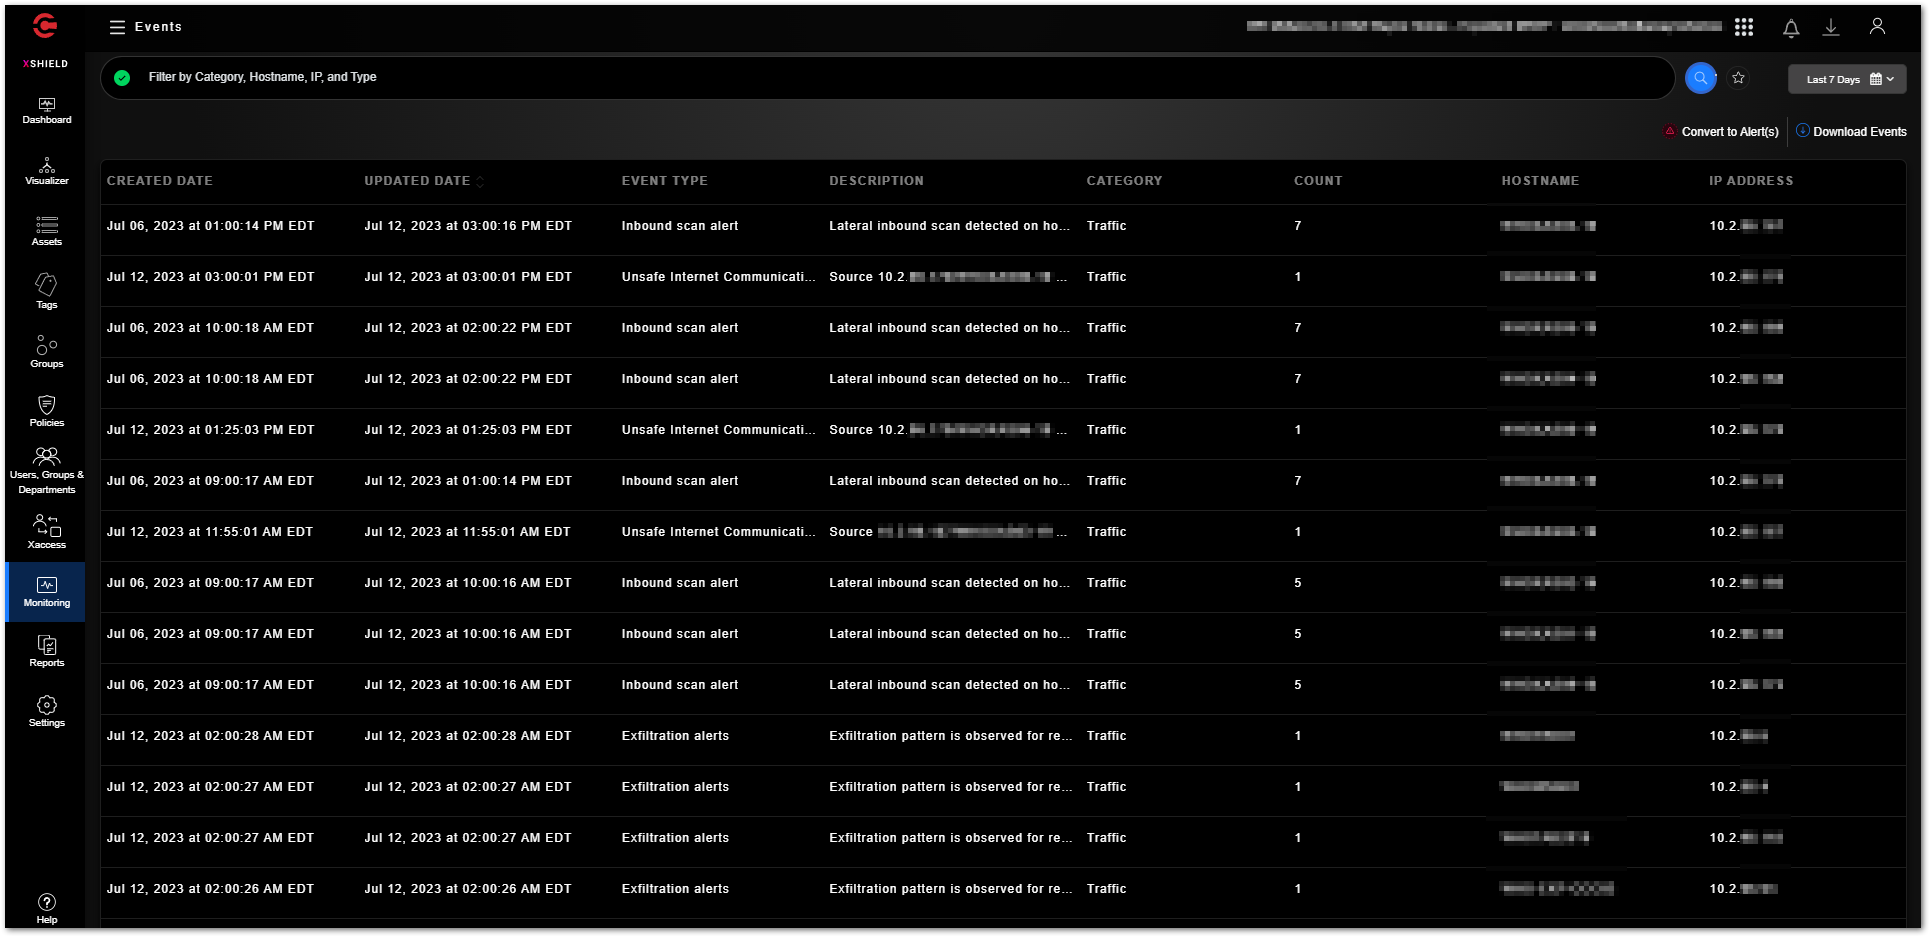
The “Monitoring - Events” section contains logs for event types such as inbound scan alerts, unsafe internet communications, data exfiltration alerts, policy violations, etc.
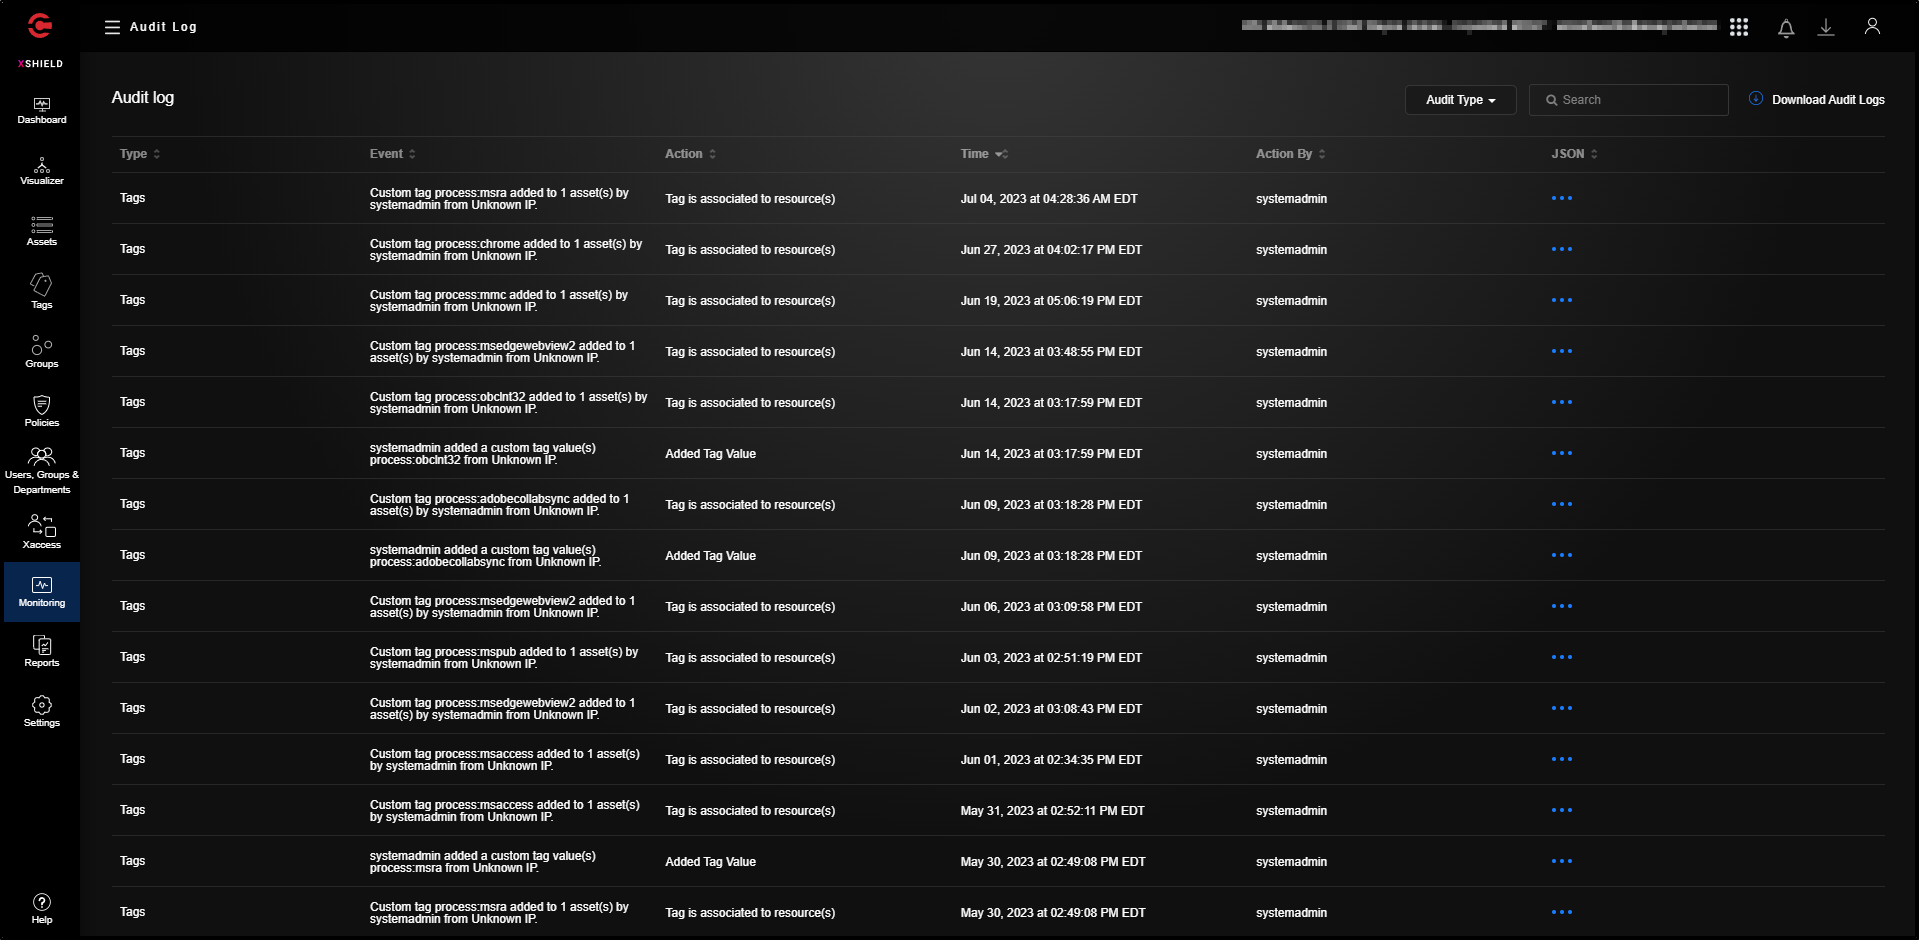
The “Monitoring - Audit Log” section logs the critical events and actions performed by users as Audit Logs. Audit logs capture the time when the events occurred, actions performed, and the actors and entities involved in the event. Audit logs can help you audit user activity on your instance and take corrective measures if needed.
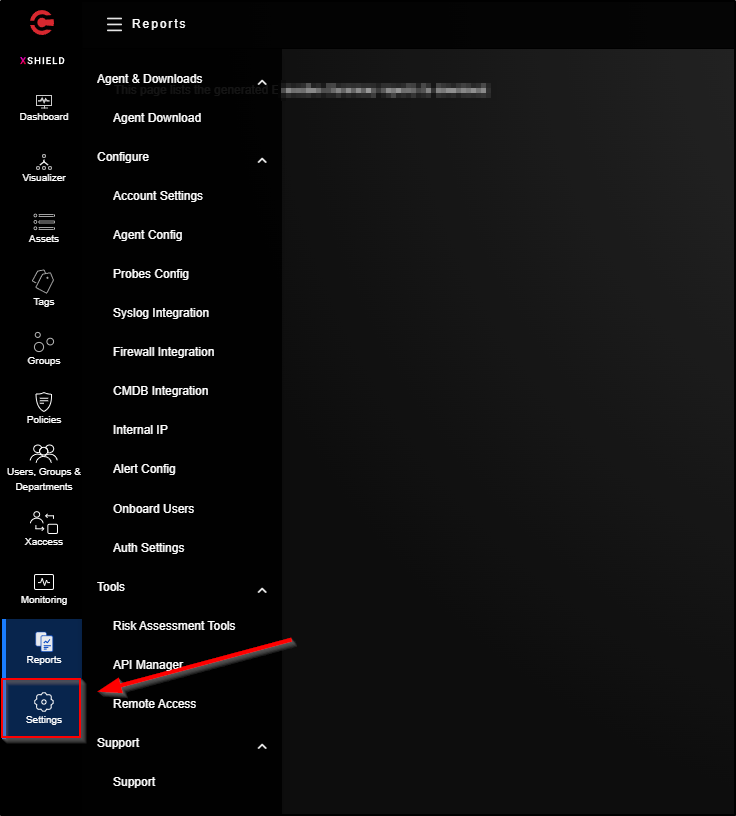
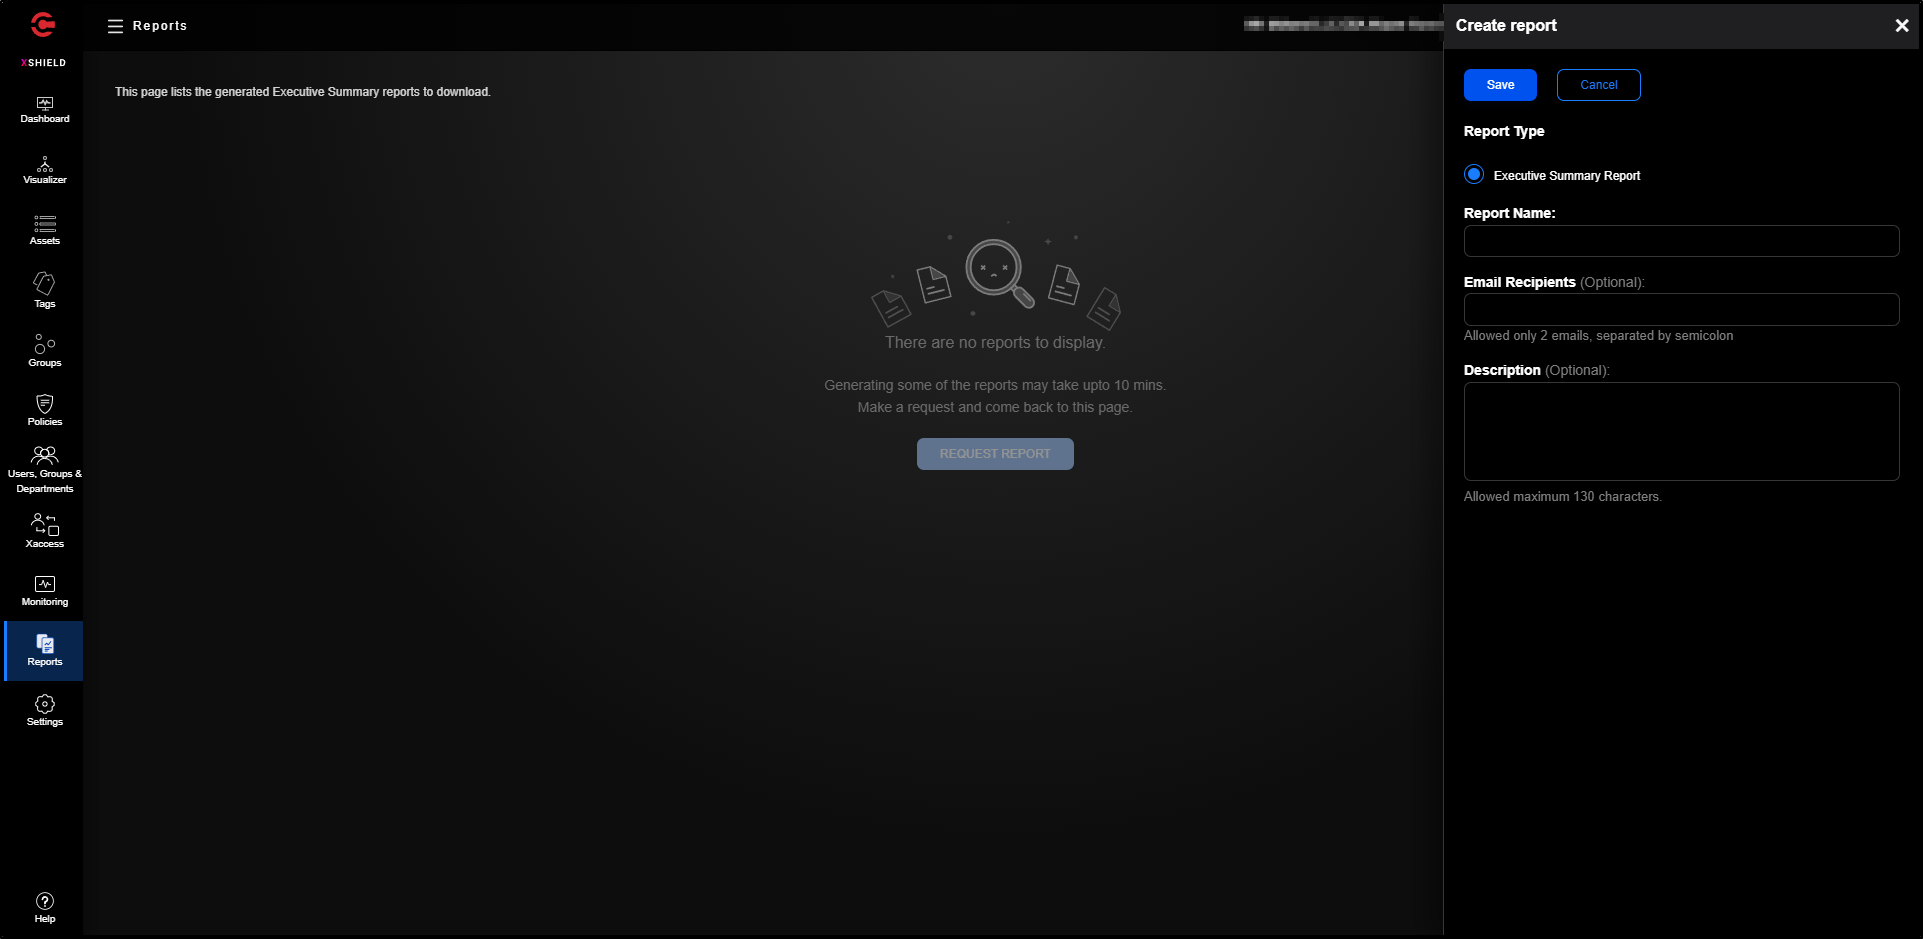
The “Reports” section allows you to generate an Executive summary report. The Executive Summary report provides an overview of your assets and their security posture in the microsegmentation journey. The report provides visibility of your workload environments and leverages data to protect workloads by defining, simulating, and enforcing policies.
The “Settings” section contains various subsections that allow you configure various administrative aspects of your microsegmentation tenant.