Microsoft System Center Operations Management – Typical Monitoring
We typically monitor our Microsoft environment through the utilization of Microsoft System Center Operations Manager 2016 (SCOM). While Microsoft has very granular options within this suite our typical monitors and thresholds are as follow:
Hardware usage (CPU, RAM, Storage, Networking, etc)
Current Logical Disk Queue Length
Description: The logical disk has had a consistently high value for the "Current Queue Length" counter over multiple consecutive samples. As a result, I/O requests latency will most likely increase on this logical disk.
Threshold: Alarm is raised if 12 samples return the value greater than or equal to 32 items in queue
Average Logical Disk Per Seconds Per Transfer
Description: The Avg. Disk sec/Transfer (LogicalDisk\Avg. Disk sec/Transfer) for the logical disk has exceeded the threshold. The performance of applications that rely on this logical disk may be negatively impacted as the disk is taking an unusually long time to service read and write requests.
Threshold: Alarm is raised if 15 samples return a value greater than 0.04s per transfer
Performance – Local Area Connection
Description: The total volume of received and sent bytes per second on the network interface has exceeded the threshold percentage of the interface's total bandwidth, over multiple samples.
Threshold: Alarm is raised if the % utilization across 12 samples exceeds 75% consistently
Memory Pages Per Second
Description: The rate at which the system is paging memory to and/or from disk is too high. This monitoring is based on the "Memory\Pages/sec" counter, which is a primary indicator of the kinds of faults that cause system-wide delays. Overall system performance may significantly diminish.
Threshold: Alarm is raised if 5000 pages per second or greater is achieved across 12 samples
Total CPU Utilization Percentage
Description: The CPU Utilization (Processor Information% Processor Time_Total and System Queue Length) for the system processor(s) has exceeded the threshold. Once exceeded overall system performance may diminish significantly which will result in poor operating system and application performance.
Threshold: Alarm is raised if 3 samples return a value of 95% or more
Free System Page Table
Description: A page table is the data structure used by the Windows Virtual Memory Manager (VMM) to store the mapping between virtual addresses and physical addresses in memory. The performance counter Free System Page Table Entries is the number of page table entries not currently used by the system.
Threshold: Alarm is raised if 5000 pages per second or greater is achieved across 6 samples
Logical Disk Free Space
Description: Monitor the percentage free space and number of free MBytes remaining on a logical disk. Only when both the low percentage free space threshold and low number of free MBytes threshold is the disk flagged as having low disk free space.
Threshold
System Drive
10% Free Space
500mb free space
Non-System Drive
10% Free Space or 500mb free space
2000mb free space
Available Megabytes of Memory
Description: The Available Megabytes (Memory\Available Megabytes) for the system has fallen below threshold. Overall system performance may significantly diminish which will result in poor operating system and application performance. Available Megabytes is the amount of physical memory that is available for use by applications and processes.
Threshold: Alarm is raised if 100 Megabytes of Memory or less is available across 3 samples.
Windows Roles
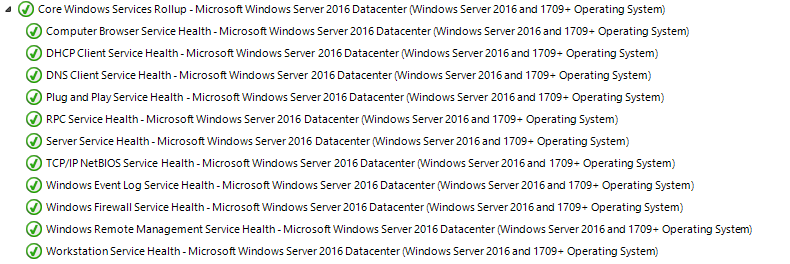
Core Windows Services Rollup
Description: The rollup monitor for all health related to critical Windows services
Threshold: On/Off
Note: This is made up of the following monitors
IIS Admin Service Availability
Description: This monitor checks the status of the IIS Admin service (IISADMIN). If you receive an alert from this monitor, action is required in order to bring the service back to an operational state.
Threshold: Checks if the IISAdmin service is operation. If the service ever halts the alert will be raised.
Web Management service availability Description:
Description: This monitor checks the status of the Web Management service (WMSvc). If you receive an alert from this monitor, action is required in order to bring the service back to an operational state.
Threshold: Checks if the WMSvc is running. If the service is halted it'll throw an alarm.
File system error or corruption
Description: Monitors whether the file system has reported an error with the file system or corruption on the logical disk.
Threshold: On / Off
Health Service Memory Utilization
Description: This rule measures the Process\Private Bytes utilization for all instances of the Monitoring Host process. If it exceeds the configured threshold, a response attempts to restart the Health Service to ensure it doesn't continue to overwhelm the computer.
Threshold: Agent = 300mb, Management Server = 1,500mb
Machine Account Determination Monitor
Description: Group Policy preprocessing uses security to act on behalf of the computer or user. Incorrect permissions or security failures can prevent Group Policy from applying to the computer or user.
Threshold: On / Off
Role Determination Monitor
Description: Group Policy preprocessing uses security to act on behalf of the computer or user. Incorrect permissions or security failures can prevent Group Policy from applying to the computer or user.
Threshold: On / Off
Others
Symantec Endpoint Service
Description: Monitors the availability of the SepMasterService to ensure that our Symantec Endpoint Protection Manager application is functioning.
Threshold: On / Off.