Alerting is configured and managed from the Kibana Management UI and provides a set of built-in rule types and connectors. Alerting allows the user to detect conditions defined by a rule. When that condition is met, the alert is created and triggers any actions configured within the rule.
In most cases, rules will be based on log, metric, and monitoring thresholds.
Log threshold - Create alarms based on conditions met from the Logs app. Alerts can be created from Observability > Logs
Metric Threshold - Create alarms based on what is listed on the Metrics Explorer page with the Metric app, Observability > Metrics
Monitoring Threshold - Create alarms based on uptime. Observability > Uptime
For example, to create a monitoring alarm for an existing URL monitored with Uptime
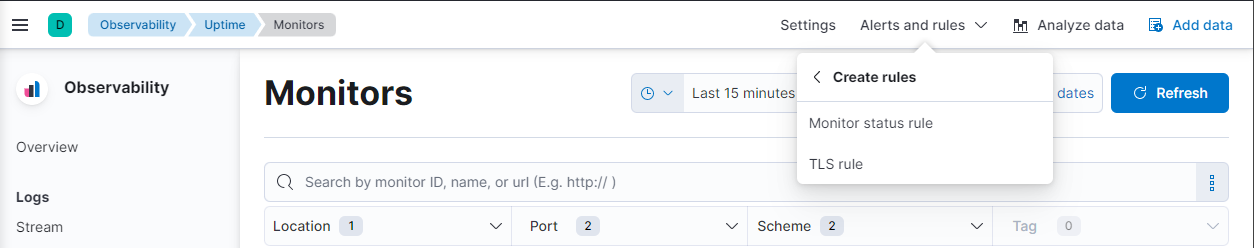
Navigate to the Uptime app: Observability > Uptime
At the top of the page, click Alerts and rules > Create rule > Monitor status rule
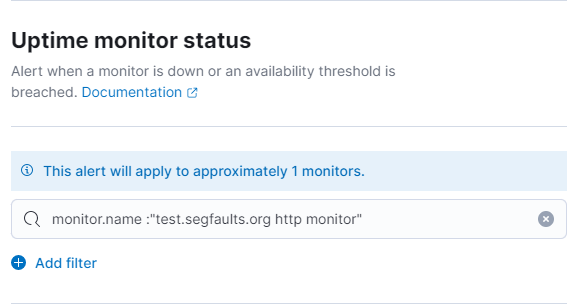
3. If multiple http monitors exist, and want add a filter using KQL syntax, you can use the monitor.name field and provide the name of the uptime monitor
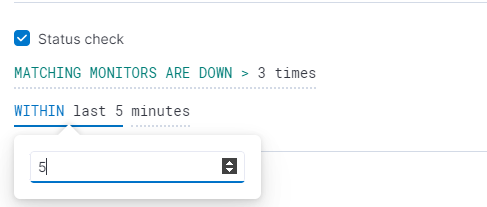
4. Update the Status Check by clicking on the conditions and selecting the values best suitable for this alarm
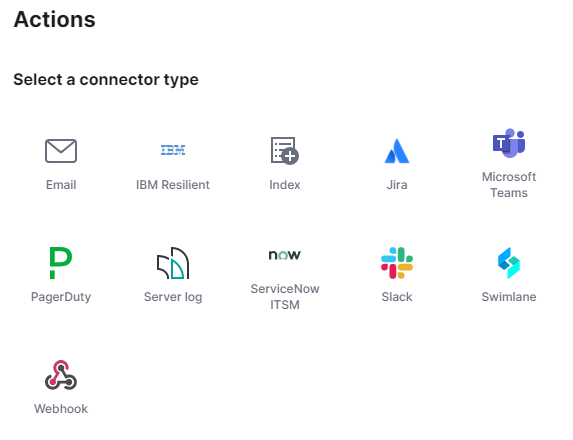
5. Configure Actions with the supported built-in integrations.